Performance Optimization in Web Applications and APIs

User Experience of a web application is one of the key factors that drive the consumer satisfaction and thus the number of consumers to the application. And one of the critical pieces of this user experience is the speed and performance of the application. Such a user experience of the responsiveness from a simple action or click in the application, or the application load time itself, in turn depend on number of factors like, response time from the upstream Server and HTTP APIs, network round trip time, time incurred in security & validations, etc. While we spend a lot of time in optimizing the performance of our application code and APIs, there are also other common factors which can help bring in significant performance optimization without much effort.
Optimizing the Response Time of HTTP APIs
The web application rendered in the web client or web browser of a user has to interact with one or more HTTP APIs on the server, for either data fetching or update calls in response to user actions. The response time of such APIs thus also affects the responsiveness of the application and the user experience. Optimizing this API response time, includes not just the server-side response time optimization, but the total response time perceived at the client or browser.
Upstream API / Database Connection Pool in the API Service
With numerous applications moving towards the microservices design model, the service hosting an API may need to make one or more upstream API calls to other services or data stores to fetch data or trigger actions. Apart from the network round trip time and the processing time at the upstream server, such an upstream call also needs to establish a HTTP Connection to the upstream including SSL Handshaking to ensure a secure connection between the two services. In order to avoid such repetitive SSL Handshakings for every upstream call, one can make use of a Connection Pool in the service client, thus maintaining a pool of active connections which can be re-used for all calls to the same upstream server. Given that establishing a new connection to the upstream is usually an expensive operation, such an active connection pool can significantly improve the overall response time of the upstream calls.
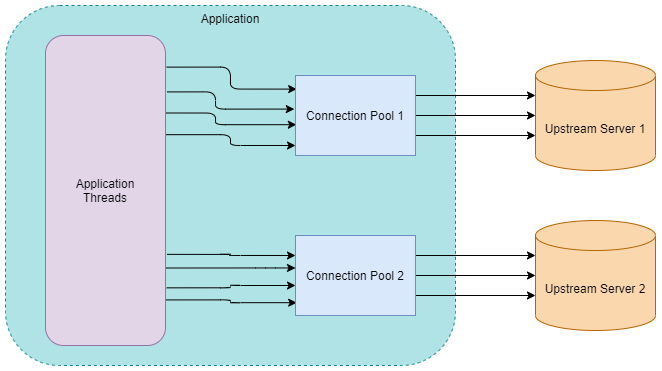
Any active connection to the upstream server in the connection pool also has a keep-alive timeout, and the connection is dropped if it goes stale and not used for more than the timeout period. This can lead to ineffective usage of connection pool for a newly rolled out service with very low user traffic. A workaround in such cases is to run a background job in the API service which can make dummy ping calls to the upstream server whenever the connection is about to timeout, and thus effectively keep the connection always alive.
Network Peering between API Service and Upstream Servers
An upstream call from the API service to another API, database or data store, also incurs a network round trip delay between the service and the upstream. In cases where it is possible to set up network peering between the upstream server and the API service, it can help not only reduce the network round trip delay but also help secure the connection to the upstream server.
HTTP Compression
In certain cases the API response from the API Service to the client, or the response from an upstream server to the API Service, can have a large size. Such large response sizes can add to the network round trip delay, due to larger number of bytes transferred over the network. To overcome this problem, HTTP exposes Content Encoding headers to transfer compressed content over the network. The server sending out such large response can compress the response and use Content-Encoding HTTP response header to specify the type of compression used. Also the client should specify the types of content encoding that it can decode to allow the server to use such compression and send out the compressed content back in response. With the right use of compression and thus lower number of bytes transferred over the network, it is possible to achieve a significant improvement in the overall response time at the client.
Cache Control
The Cache-Control HTTP Header exposes number of different caching directives which can be useful in various use-cases and scenarios. While we may not want to cache an API response in the browser like we cache the static content, some other cache control directives can be useful in many cases where a slight delay or inconsistency in reflecting the server-side data changes on the client is acceptable, while improving the application performance significantly. As an example, a value of “stale-while-revalidate” in the Cache Control Header will allow the client to accept a stale response, while asynchronously check for a fresh response in the background, thus ensuring a fresh response within couple of reloads of the app or the app component. Or one case use “no-cache” to force the browser to always validate the cached content with the origin server before using it.
Unified API Domain
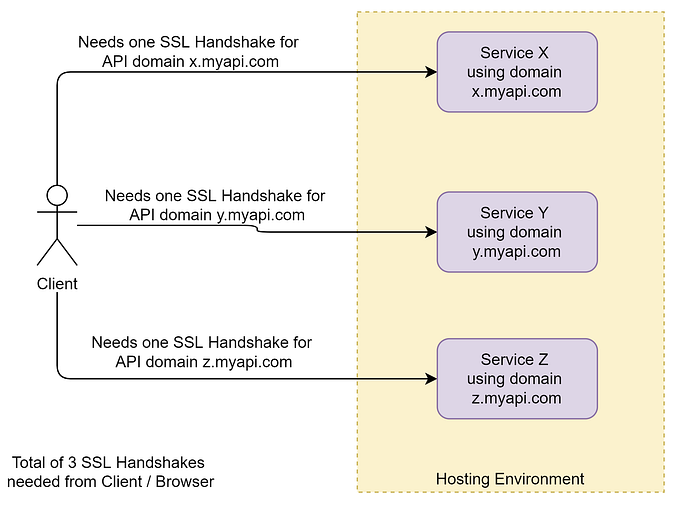
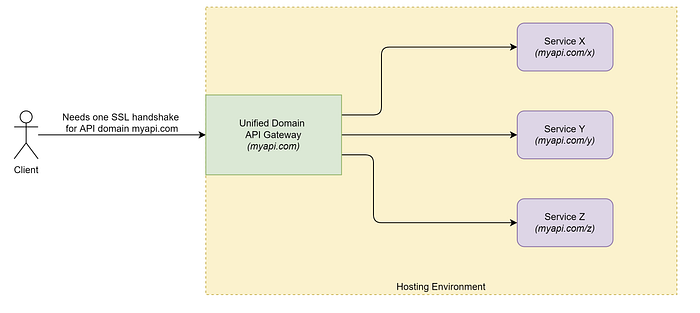
An API Call from the browser to the API Service also incurs a connection setup & SSL handshaking delay. And while we could optimize the connection setup latency to upstream servers within our API Service using Connection Pooling, here each user uses it’s own client or browser instance, and thus a connection pool used by the client or browser is independent for each independent user. Thus each first call from the client to any API domain will have to go through such connection setup time, adding it’s latency to the overall response time of the API. And further such a connection needs to be refreshed every time it goes stale. But the number of such connection setups can be minimized by using an API Gateway and thus a unified API domain for all of the API calls from the client. This way the client can establish the connection to the API Gateway for the first API call, and then re-use the same connection for all of the further API calls from the client, thus getting rid of such connection setup latency for most of it’s API calls.
Optimization in CORS and Pre-flight Requests
Cross-Origin Resource Sharing (CORS) allows a server to indicate that apart from the domain of the loaded page in the browser, what other origins (domains) are permitted to call the server’s APIs or load it’s resources from the browser. CORS is accompanied with a “preflight” request from the browser to the server, to check if the server will permit the actual request. Such preflight requests can further add to the overall latency in retrieving the response from APIs. But with the right use of CORS response headers and API request, it is possible to minimize and avoid unnecessary preflight requests, and thus optimize the overall response time.
In most of the cases, the API Service or Gateway can set the response header “Access-Control-Max-Age” to it’s max limit of 86400 (24 hours), and thus avoid repetition of such preflight requests from the client. Along with this, the client can also force the preflight request in advance before the actual need to make the API call, and thus hide the preflight request latency from the user. It is also possible for the server to allow calling non-sensitive APIs using Simple Requests, and thus completely avoid preflight requests for such calls.
GraphQL or HTTP Request Batching
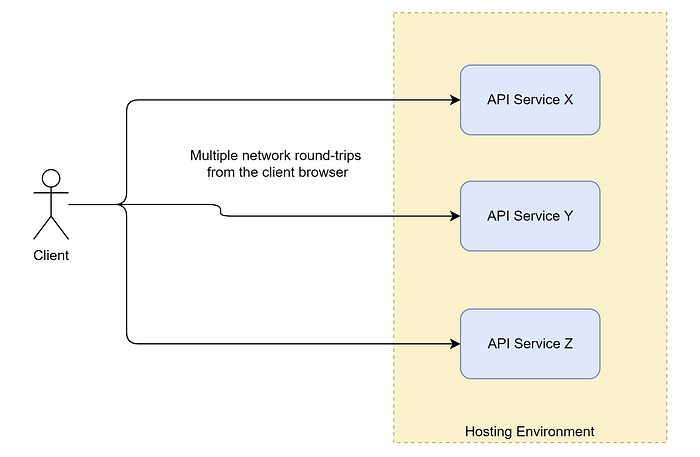
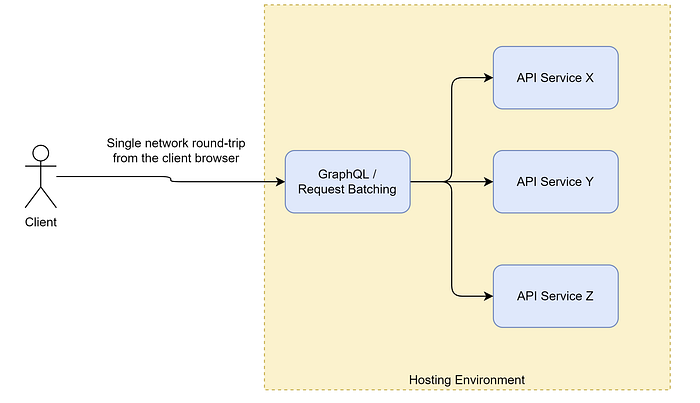
One of the key contributors to the overall response time measured on the client, is the network round trip delay between the client and the API Service. Also it’s important to note that this delay can vary significantly based on the network bandwidth and internet connection of the consumers, and thus it is crucial to monitor various percentiles (like 50p/75p/90p/etc) of the overall response times measured at the client across application users, to find the performance observed by majority of the application users.
One of the ways to avoid such network delays and optimize application performance, is to reduce the number of network round trips between the client and the server. GraphQL is a great way to address not only such problem of under-fetching reducing the number of network round-trips, but it also addresses the problem of over-fetching and thus avoids unnecessary data payload in response. Another simple way to reduce the network round trips is to use HTTP Request Batching, thus allowing the client to make more than one API requests in a single call to the server.
API Accelerators
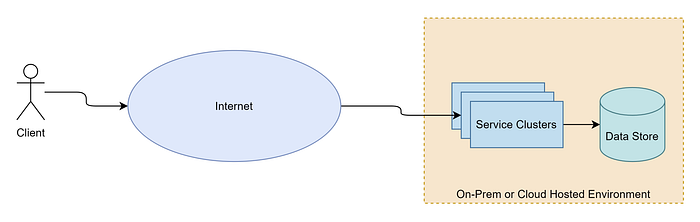
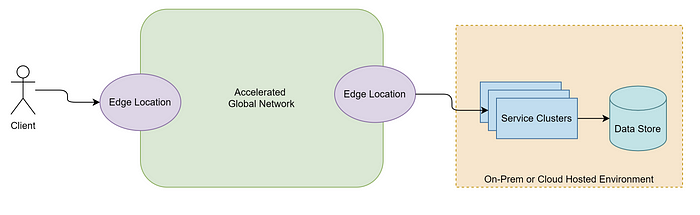
While GraphQL can help reduce the number of network round trips between the client and the server, we can further use API Accelerators to optimize on the network round trip delay itself from the client to the server. Azure Frontdoor or Amazon Cloudfront are examples of such API Accelerator solutions available in the market. These cloud providers provide high network bandwidth connection from an edge node near to the client to the application server, thus reducing the network round-trip delay significantly.
Optimizing the Static Content and App Rendition
While the above section discusses ways to optimize the Web Application Performance by optimizing the end to end API performance perceived on the client, many similar ways can be used to also optimize the performance of the static content and app rendition itself.
Content Delivery Network (CDN)
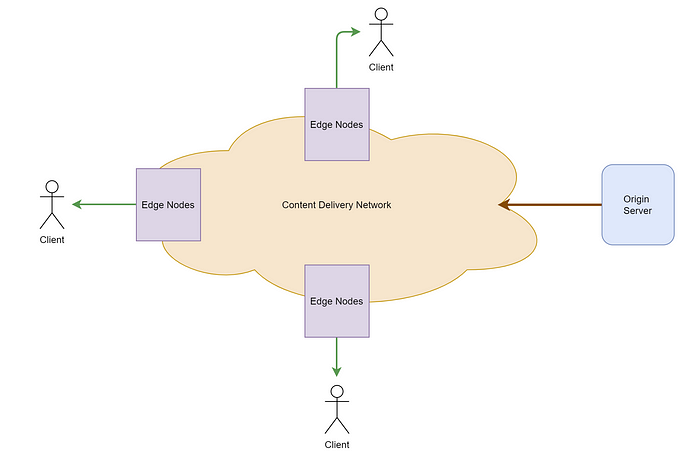
Serving the Static Content via CDN is a pretty common and popular approach used to not only minimize the load time of static content at the client, but also leverage high availability provided by the CDN. Content Delivery Network is a geographically distributed network of proxy servers which work together to provide fast delivery of Internet content. Many cloud providers including AWS/Azure/Google provide such CDN solution using globally distributed CDN Servers located close to users. Distributing static content closer to the visitors using such CDN servers, helps provide visitors a smooth experience with faster page load times.
Minified JS/CSS
Running a web application in the browser requires loading the application code including Javascript and CSS Files into the browser. This application code can easily grow into several Megabytes of size, which can slow down the load time of the application code into the browser. This is where JS/CSS Minification comes to the rescue, and helps reduce the size of the application code by removing comments, extra spaces, and crunching variable names. Such minified file provides the same functionality while reducing the network bandwidth required to load the application code. While most of the commonly used JS Module Bundlers like Webpack provide such minification capability out of the box, there are also several other Open Source JS/CSS Minifiers available to help with such minification.
HTTP Compression
While we already saw how HTTP Compression can help optimize the performance of our APIs, it’s also commonly used to help reduce the load times for static assets. Many web servers, like NGINX, and Cloud Provider CDNs, provide out of the box support for such compression on static assets, and it is easy to leverage this optimization using the right configurations.
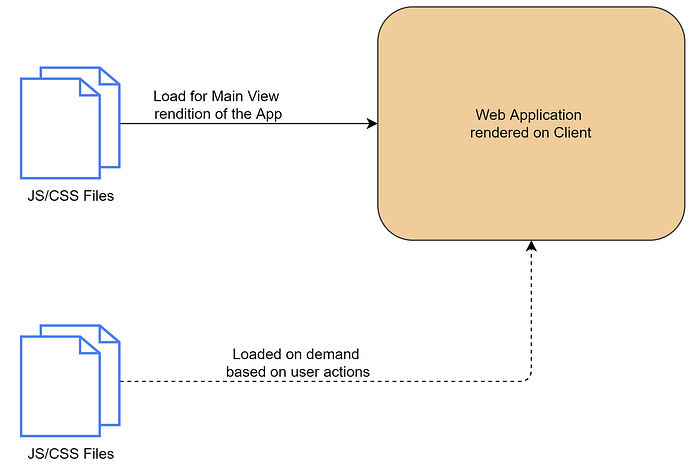
Code Splitting and Lazy Loading
If you have a large application comprising of several components, it might be a good idea to split the application into more than one bundles, based on desired use-case and functionality of various components in the application. As an example, there is no need to load the code for a chat box component into the browser, until the user clicks on a Support or Chat button. Since it’s a specific action driving the rendition of such a component, the component might not be required to be rendered for most of the application users. The splitting of code into multiple bundles, can reduce the size of the main bundle that’s required to be loaded as part of the page load, and thus reduce the application load time. Such delay in the loading of bundles based on the need to render some component is also referred to as Lazy Loading, where a bundle or component load is usually triggered by some specific user action. Again most of the commonly used JS Module Bundlers support such code splitting.
Although Code Splitting can be very useful in optimizing the application load time & user experience, defining and selecting such independent modules for lazy loading needs to be carefully thought through to ensure it doesn’t lead into performance degradation instead, due to unnecessary over-splitting of code. Lazy loading for UI components which users frequently interact with immediately after the application load, can lead into several independent network requests to load all such modules at application load time, and thus several network round-trips instead of one. This can effectively degrade the application load time performance instead of improving the same.
Caching
Caching the static content in the browser can significantly improve the application load time for future visits by a user. Since such static content would often change only at new code deployments, such caching of content can help get rid of several network requests required to load the application code, for a significant percentage of user visits. And then using the right caching strategies, you can always force the browser into loading the fresh JS/CSS content when the content changes.
Prefetch, Preconnect and Prerender
While modern web browsers use various techniques to optimize page load performance by anticipating what the user is likely to do next, the developer of the web application would often have the best insights on what a user may be likely to do next after page load or a previous set of actions, and thus can take the best decisions around what resources to pre-fetch, or what origin to connect to even before the user triggers an action, or what component to render in advance.
Prefetch, Preconnect , Prerender and other such primitives, also referred to as Resource Hints, allow the developer to assist the user agent or the browser in the decision process of which origins it should connect to, and which resources it should fetch and preprocess to improve page performance, and thus can help hide some of the networking, processing, and rendering latencies from the users.
Upgrade to HTTP/2
HTTP/2 offers several improvements over HTTP/1.1 including many performance optimizations. With features like Multiplexing, Header Compression, Binary Format Transmission, Server Push, HTTP/2 can help deliver a much better performance and web experience, without even requiring any significant effort from the developers.
Performance Monitoring
While all the techniques discussed in the sections above can help improve the performance of an application, it is also important to monitor the specific areas of improvement for a given application using sufficient monitoring of various user actions, workflows, end to end API response time, and other load times in the web application. A good metric collection and monitoring framework is also required to analyze the performance improvements achieved from incorporating any of these techniques. New Relic RUM or Splunk RUM are just couple of tools among several other such tools that can collect such user metrics in the client application, and thus help keep a track of the performance of your web application as perceived by your end users.
References
- https://docs.oracle.com/cd/E24693_01/appdev.11203/e10646/oci09adv.htm
- https://graphql.org/
- https://docs.microsoft.com/en-us/graph/json-batching
- https://medium.com/adobetech/an-http-caching-strategy-for-static-assets-the-problem-f61f3d943f3
- https://reactjs.org/docs/code-splitting.html
- https://developer.mozilla.org/en-US/docs/Glossary/Code_splitting
- https://developer.mozilla.org/en-US/docs/Web/HTTP/Headers/Cache-Control
- https://developer.mozilla.org/en-US/docs/Web/HTTP/Headers/Keep-Alive
- https://developer.mozilla.org/en-US/docs/Web/HTTP/Headers/Content-Encoding
- https://developer.mozilla.org/en-US/docs/Glossary/Preflight_request
- https://www.w3.org/TR/resource-hints/
- https://docs.microsoft.com/en-in/azure/cdn/cdn-overview
- https://docs.aws.amazon.com/AmazonCloudFront/latest/DeveloperGuide/Introduction.html
- https://docs.microsoft.com/en-in/azure/frontdoor/front-door-overview